- Bitcoin price started a strong rise above the $7,800 and $8,000 resistances against the US Dollar.
- The price gained traction and even traded close to the $8,200 resistance area.
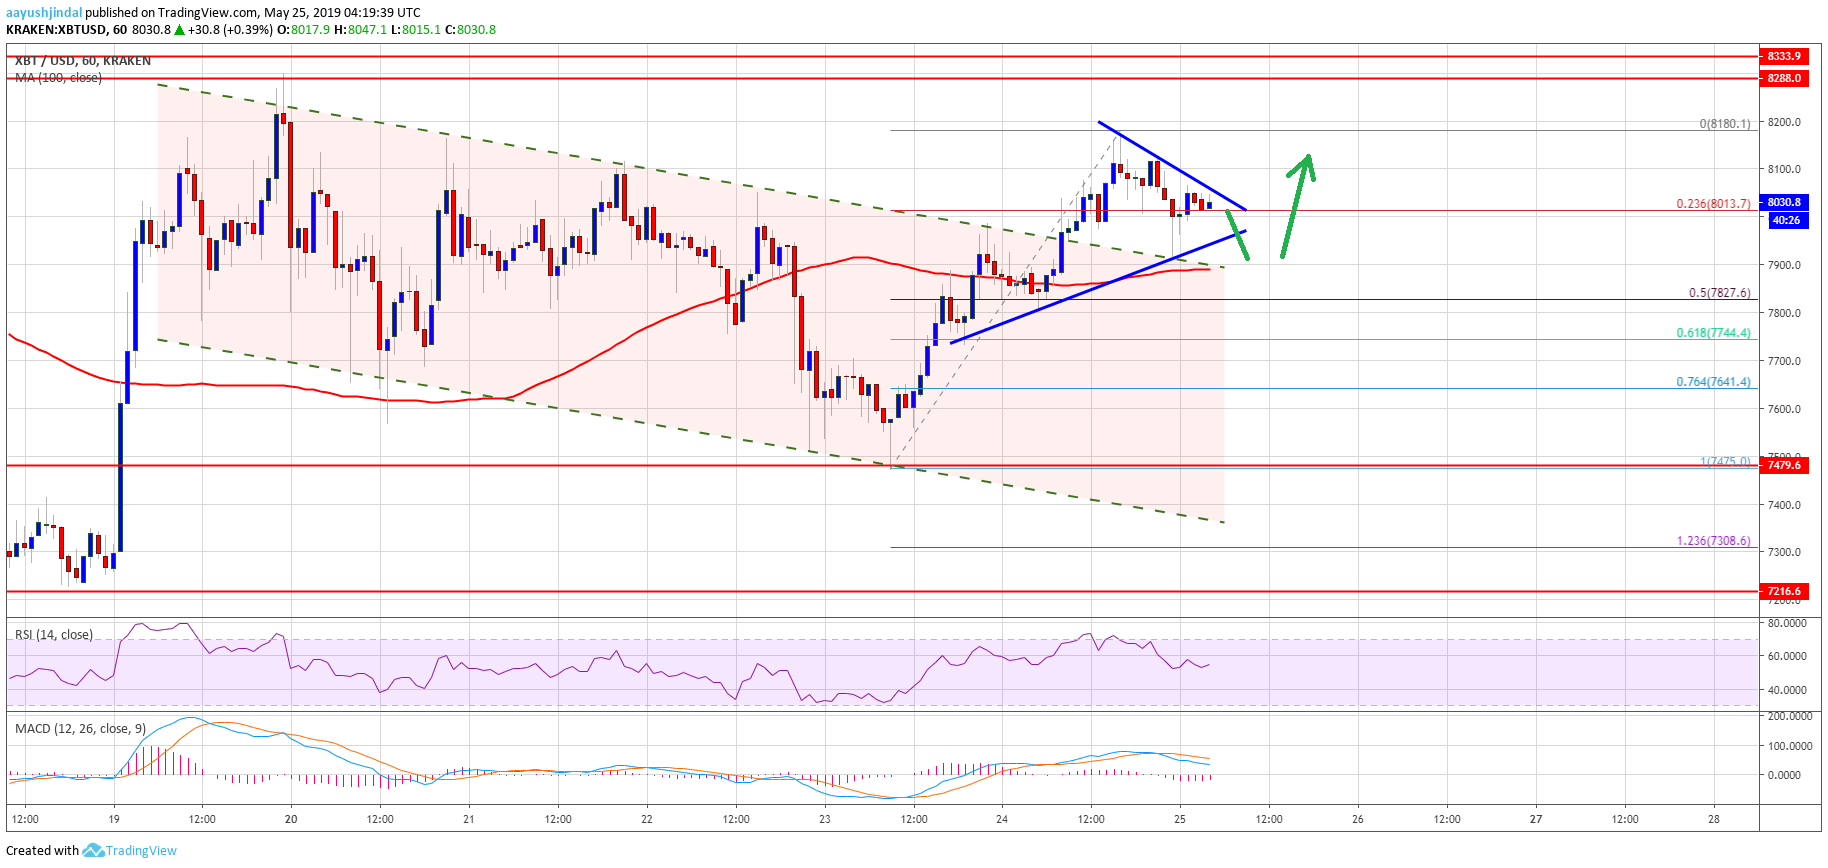
- This week’s followed important declining channel was breached near $7,960 on the hourly chart of the BTC/USD pair (data feed from Kraken).
- The pair is currently forming a triangle pattern and it could continue higher above $8,150 and $8,200.
Bitcoin price jumped back into a positive zone above $7,800 against the US Dollar. BTC is currently forming a bullish pattern and it may continue to rise towards $8,300 an 8,500 in the near term.
Bitcoin Price Analysis
Recently, we saw a strong bounce in bitcoin price from the $7,475 swing low against the US Dollar. The BTC/USD pair surged higher and broke many hurdles near $7,700 and $7,800. There was even a break above the $8,000 level and the 100 hourly simple moving average. It seems like the bulls are back in action and the price completed a downside correction near the $7,500 support area. This also suggests that there are chances of more gains above the $8,200 level.
Recently, this week’s followed important declining channel was breached near $7,960 on the hourly chart of the BTC/USD pair. The pair spiked towards the $8,200 level and formed an intraday high at $8,180. The price is currently consolidating gains above $8,000. Moreover, it traded below the $8,100 level and the 23.6% Fib retracement level of the upward move from the $7,475 low to $8,180 high. However, the broken resistance near the $7,960 and $8,000 levels is currently acting as a strong support.
Besides, the pair is currently forming a triangle pattern with resistance near $8,050 on the same chart. Therefore, if the pair clears the triangle resistance and surges above $8,100, there could be solid gains in the coming sessions. The next key resistances area near the $8,200 and $8,300 levels. Above these, the price is likely to trade to a new 2019 high.
Looking at the chart, bitcoin price clearly jumped back into a positive zone above $7,800. It is currently consolidating gains above the $8,000 level and the 100 hourly SMA. If there is a downside break below the 100 hourly SMA, the price could correct lower towards the $7,710 level. Below $7,710, the next key support is close to the $7,650 level.
Technical indicators:
Hourly MACD – The MACD is currently in the bearish zone, but it could move back in the bullish zone.
Hourly RSI (Relative Strength Index) – The RSI for BTC/USD is holding the main 50 level, with a few positive signs.
Major Support Levels – $7,800 followed by $7,710.
Major Resistance Levels – $8,050, $8,200 and $8,300.
Bitcoin (BTC) Price Smashes Resistance: Bulls Target Fresh High BEST WALLET, bitcoin cash wallet, bitcoin wallet, btc wallet, buy bitcoin, buy cryptocurrency, coin wallet, crypto wallet cryptocurrency wallet, Digital Wallet, ether wallet, ethereum wallet, safest wallet, secure crypto wallet, usd to bitcoin , blockchain, block chain, blockchain wallet, what is blockchain, blockchain info keywords bitcoin price ethereum price bitcoin news coinmarketcap BTC price coinbase bitcoin Scam News btc


No comments:
Post a Comment